I used SQL Workbench/J to help the business answer questions about their total sales, best customers, and the total sales for each product area. This information can be used to support strategic decisions or to report latest results to stakeholders. This information can be used to support strategic decisions or to report latest results to stakeholders. (I have more SQL queries in my SQL repository, please follow this link)
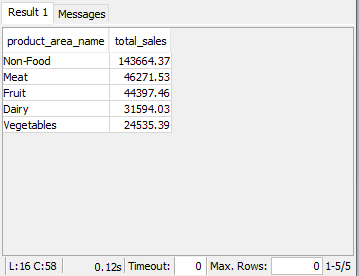
Question 1: What were the total sales for each product area name for July 2020? Returning these in the order of highest sales to lowest sales
SQL CODE:
SELECT b.product_area_name,
       SUM(a.sales_cost) AS total_sales
FROM grocery_db.transactions a
INNER JOIN grocery_db.product_areas b ON a.product_area_id=b.product_area_id
WHERE a.transaction_date BETWEEN '2020-07-01' AND '2020-07-31'
GROUP BY b.product_area_name
ORDER BY total_sales DESC;
RESULT 1:

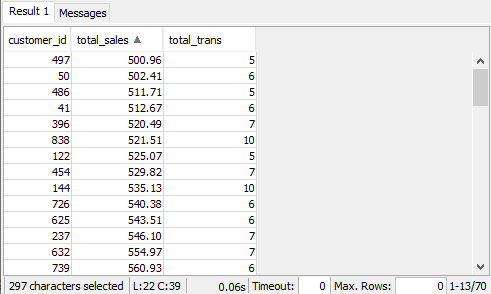
Question 2: Returning a list of customers who spent more than $500 and had 5 or more unique transactions in the month of August 2020
SQL CODE:
SELECT customer_id,
       SUM(sales_cost) AS total_sales,
       COUNT(distinct(transaction_id)) AS total_trans
FROM grocery_db.transactions
WHERE transaction_date BETWEEN '2020-08-01' AND '2020-08-31'
GROUP BY customer_id
HAVING SUM(sales_cost) > 500 AND COUNT(DISTINCT(transaction_id)) >= 5;
RESULT 2:

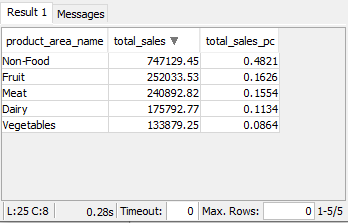
Question 3: Returning data showing, for each product area name - the total sales, and the percentage of overall sales that each product area makes up using Common Table Expression (CTE)
SQL CODE:
WITH sales AS (
SELECT b.product_area_name,
       SUM(a.sales_cost) AS total_sales
FROM grocery_db.transactions a
INNER JOIN grocery_db.product_areas b ON a.product_area_id=b.product_area_id
GROUP BY b.product_area_name
 )
SELECT product_area_name,
       total_sales,
       total_sales / (SELECT SUM(total_sales) FROM sales) AS total_sales_pc
FROM sales;
RESULT 3:

Photo source: john_schnobrich/Unsplash